
[ For a general introduction to ML/AI check out this introductory post: https://jacace.wordpress.com/2019/11/11/ml-programming-the-unprogramable/https://jacace.wordpress.com/2019/11/11/ml-programming-the-unprogramable/ ]
1 Introduction
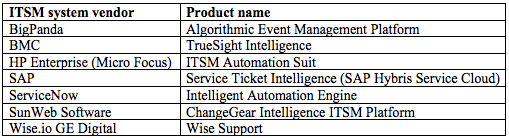
Before talking about tools one should start to define a challenging question or problem to solve. Then you need sample data because in ML a function (called Model, i.e. the algorithm) is developed, trained and evaluated for accuracy using sample data. There are already well-established use cases in the ML space, to the point that academics (sample thesis here) and ITSM system vendors already feature ML capabilities as per summary below (extracted from here).
ML capabilities for ITSM fall within the following categories:
- Supervised ML classification
- Unsupervised ML clustering problem assigning a new ticket to a cluster of known solutions
- Automatic ticket solution
- Predictions about how long it will take to resolve the ticket*.
Below there are some documented use cases of Supervised ML classification:
- Create a model for automatic support tickets classification: Endava and Microsoft developed a POC to automatically convert emails into tickets and assign values to properties like: ticket_type, urgency, impact, category, etc. The anonymized data set of 50k records is here, the source code is here. They applied multiple steps including the below.
- Data Preparation (a.k.a. Transformation): like Select required columns from the dataset, clean missing values, remove stop words, remove duplicate char, replace numbers, convert to lower case, stem words etc. Their distribution of values for most of columns to classify is strongly unbalanced but could not fix it with existing techniques (see techniques here).
- ML Algorithms: to train models, Support Vector Machines -SVM- and Naive Bayes algorithms were tested. The
ticket_typecolumn was calculated using the best hyperparameters obtained with GridSearchCV (improved precision by 4%) - Results: for the tycket_type column, the precision was 98% in average.
- Additional notes:
- This example is also in the in the Azure AI Gallery, in that version they also use feature hashing/engineering to convert variable-length text to equal length numeric feature vector to reduce dimensionality and Filter based feature selection to get top 5000 features using the Chi-squared score function. Also the Split Data module to split data into Test and Training, as rule of thumb it can be divided into 70- 30 ratio for training and testing respectively.
- Because one class which covers 70-90% of the data, the results for columns category, impact and urgency are completely rigged. The results for the column business_service are also flawed because a lot of classes that were not at all recognized.
- Incident Routing: «Almost 30–40% of incident tickets are not routed to the right team and the tickets keep roaming around and around and by the time it reaches the right team, the issue might have widespread and reached the top management inviting a lot of trouble» (extracted from here, source code here).
- Their Data processing Pipeline is made of the following stages: Data Preparation, calculation of feature vector of input data, ML Algorithm (in this case: CNN, RNN, HAN) and finally creation of Predictive Model to make label predictions.
- Data Preparation: they classified the DataSet using Topic Modelling to make a labelled dataset and find the top categories of incidents. In Topic Modelling, each document is represented as a distribution over topics and each topic is represented as a distribution over words. Then NLTK** (Natural Language Toolkit / Python to work with human language data) Wordnet is used to find synonyms and WordNetLemmatizer is used get the root word. The list of words is converted to a dictionary and then to a bag-of-words model for LDA (Linear discriminant analysis) to find the 5 top topics, which are used to label the dataset. Then the resulting model is visualised with pyLDAvis.
- ML Algorithms: the algorithms tested in the model include Recurrent Neural Network (RNN) and Long Short Term Memory networks (LSTMs). LSTMs is applied to use Keras (and more specifically Keras Tokenizer class).
- Results: RNN (without LSTM) scored 66% and LSTM network layer 69% respectively.
- Their Data processing Pipeline is made of the following stages: Data Preparation, calculation of feature vector of input data, ML Algorithm (in this case: CNN, RNN, HAN) and finally creation of Predictive Model to make label predictions.
- Classification of incoming ticket: the distributions of classes are strongly skewed towards the first three of the seven ticket categories (e.g.: password reset). Ticket data are highly structured except for the symptom descriptions, so text analytics / data preparation phase is the most challenging part.
- Data Preparation: records are vectorized using the «Term frequency-Inverse document frequency Tf-Idf«, which is a standard method for measuring the relative importance of a term within a textual structure.
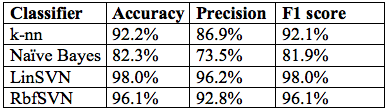
- ML Algorithms (a.k.a. Modelling Phases): The classification algorithms trained include linear (LinSVM) and radial basis function SVM (RbfSVM), k-nearest neighbors (k-nn), and Naïve Bayes (NB). NB is used for text classification and SMS spam detection (similar to Data2Class, Delany, 2012).
- Results:
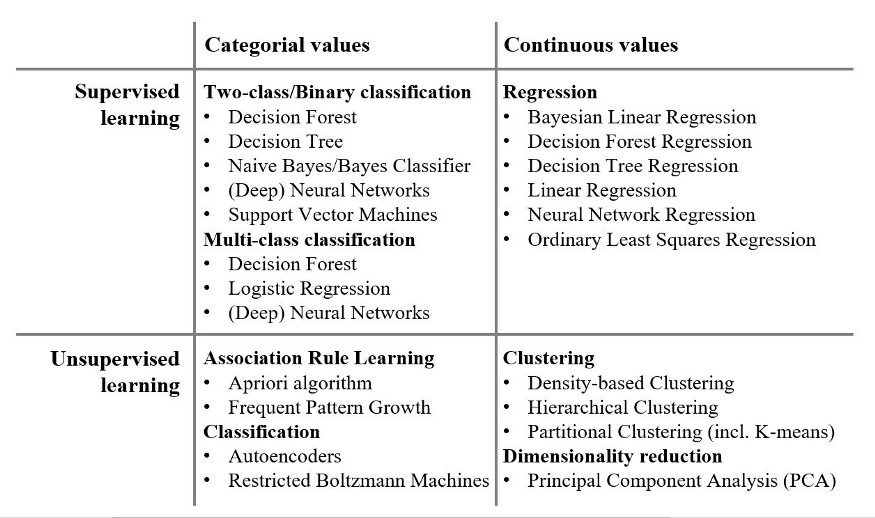
3 Widely-used ML algorithms structured by problem class
Extracted from here.
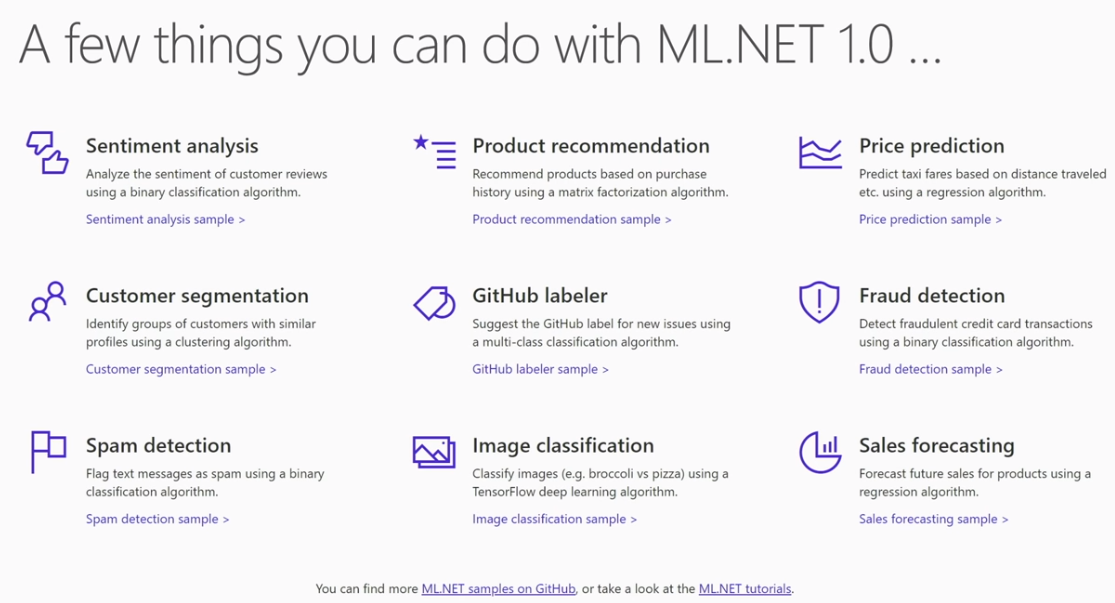
3 Tool: ML.Net
Data Science is not only for Data Scientists, Developers, BI Developers and BI analysts can also use AI/ML tools. In Data Science, the code is not the most challenging part. what is difficult is to find out which data and algorithms suits your use case. The resulting code is indeed very compact as per example below.
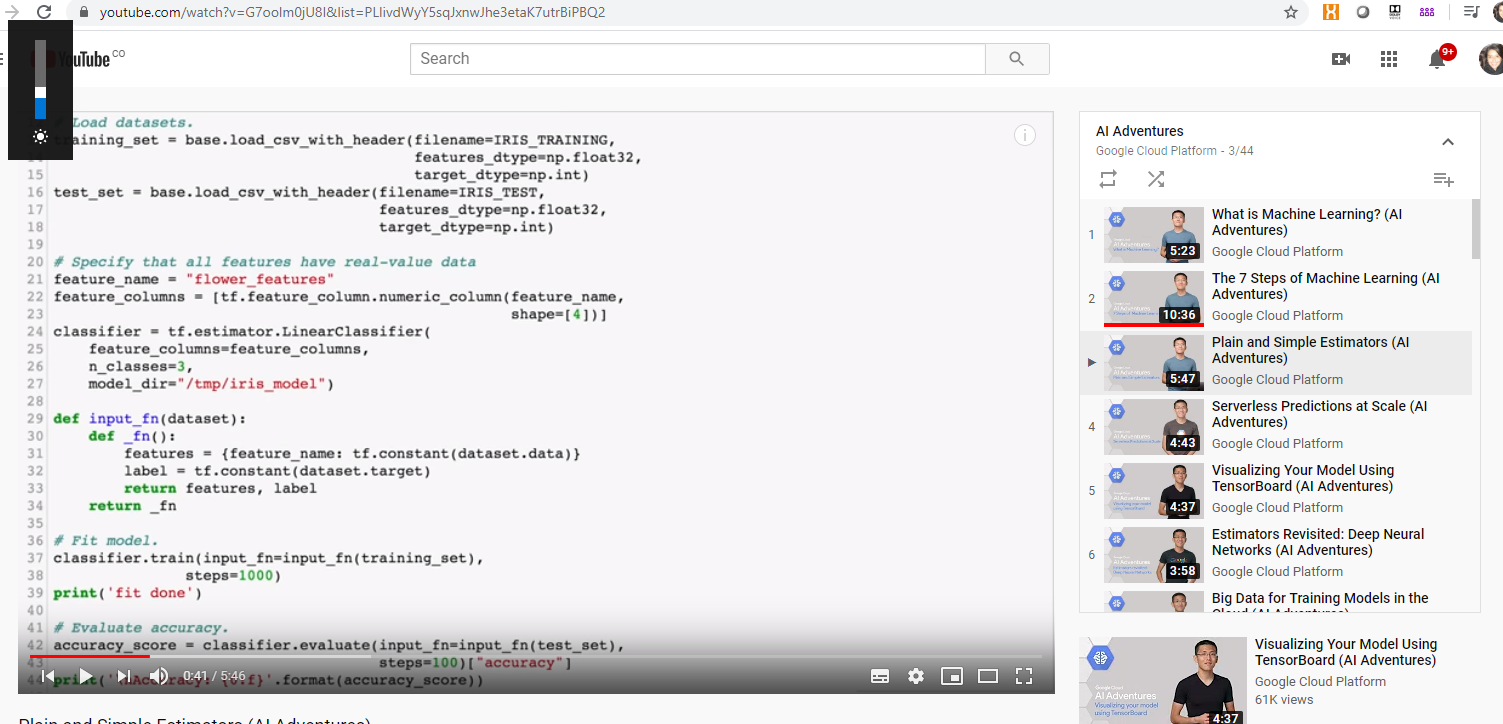
- ML.NET is just another tool which makes easier to load data from a file or SQL and it provides lots of models.
4 Glossary
- Confusion matrix: predicted VS actual classifications.
- Feature vector: n-dimensional vector of numerical features that represent some object
- Model Scoring/Evaluation: to evaluate a model the standard evaluation metrics Accuracy, Precision, and F1 score is used.
- Pickle file: exported serialised model in python, including model name, hyperparameters and weights of the model.
- Vector: a vector is a tuple of one or more values called scalars, e.g.: v = (v1, v2, v3). Vectors of equal length can be added, subtracted, multiplied, divided, etc. To define a vector in numpy:
- from numpy import array
- v = array([1, 2, 3])
- print(v)
6. Footnotes
*: not sure if this is the right category
**: There are other Python modules beyond NLTK, like: sklearn, matplotlib, pandas, etc.
Thanks,
Javier Caceres

Deja un comentario